
The Curse and the Blessing But Mostly the Blessing of Multimodality
Posted by Yuling Yao on Jul 30, 2019.I will present the main idea of this work this Wednesday 11:35 at JSM session 513.
(I notice Chrome cannot load all pictures on this page while safari seems fine so the link should be fine. In that case simply click “open image in new tab” for broken images)
All models are wrong, and all computations are wrong(ish) too.
Modern statistical computation methods are rarely deterministic. There are always randomness coming from initialization, sub-sampling of mini batch, Monte Carlo integration in stochastic approximation, and so on. In the best case scenario with all the assumptions about convexity (in optimization) and ergodicity (in Markov Chain), and after infinite number of iterations, we get some theoretical consistency and convergence –expect we cannot run infinite number of iterations, and objective functions in many optimization task is highly multimodal, and the MCMC trajectory can be highly metastable.
The traditional practice of Bayesian computation has little room for computation averaging: In MCMC, the focus is mixing – and we should just wait, wait until all chains mixes and then we get the true posterior. In optimization-based methods such as VI or Laplace approximation, we are trying to find a global mode, even if there is never guarantee why we should end up with it in a multimodal landscape.
From a practical perspective, a modeler collects his data $y$ and writes down his model $p(\theta)p(y\vert \theta)$. He throws everything into stan, and he runs stan for eight chains, and very unfortunately he gets the new rank-based $\hat R$ diagnostics for some parameters to be, say 2. What should he do?
Yes he shall run a longer chain, waiting until all chains mixing with each other. But here comes the curse of multimodality: Even the optimally-tuned HMC algorithm has a running time that is as slow as Random-Walk Metropolis (RWM) algorithm (Mangoubi and Smith, 2018), offsetting all of its mixing time efficiency in the ideal log-concave situation.
Even he has infinite computation resource, should he always be encouraged to run a single long chain, instead of multiple but potentially shorter chains? Modern computation methods can hardly be efficient if it does not fully utilize parallelization. We can have within chain parallelization, whereas the communication/coordinate cost is then a concern.
Tempering/Annealing is one solution of course, sadly it does not scale well in the high dimensional setting. Moreover, both Tempering and Annealing were first introduced as an optimization technique that enabled better exploration of global optimum. MCMC has its unique challenge: conceptually there are two types of metastability: energy barrier vs entropy barrier. In the latter case, the typical sets are linked by a very thin neck. In the extreme case when the neck and mouth have uniform density, tempering has no effect at all, while the random walk in the high dimension still prevents uniform sampling.
The idea is that we can embrace multiple heterogeneous chain. Instead of viewing their existence purely an annoying indicator of poor mixing, we view them as some brave attempt to explore typical set. Yes they do not mix, but can they still be informative, at least at some local regions, of the typical set?
Attraction probability and Bayesian model averaging
Assuming an ideal situation, the true posterior distribution is a mixture of disjoint normals, denoted by $M_1,…,M_k$. In HMC, the momentum is effectively a chi square distribution so the tail probability of excessing the energy barrier imposed by the normal tail is really low, which means we would never mix if we run multiple chains. So we get a warning in Stan: some R hat is larger than 1. Indeed much larger than 1.
Uhhh, we might ignore the warning, extract the posterior samples anyway. Effectively that is averaging over all chains uniformly. If the posterior is indeed a mixture of two symmetric normals with the same hight and the distribution of the initialization is also symmetric, then it is probably still gives the correct answer. But other than this ideal case, it is rarely correct.
Now if we have $J$ potentially non-mixing chains $(x_{1,1}, x_{1,S} ),\dots, (x_{j,1}, x_{j,S} )$, where $x_{j,1}\sim p_{initial}(x)$. let’s consider a general form of Monte Carlo estimates:
\[\mathrm{E}(h)=\sum_{j,s} w_{j,s} h(x_{j,s}) /\sum_{j,s} w_{j,s}\]It is a natural generalization of the Monte Carlo estimates $\mathrm{E}(h)=J^{-1} S^{-1} \sum_{j,s} h(x_{j,s})$ where $w_{j,s}= (JS)^{-1}$.
Natually we can use importance sampling to compute any integration as
\[\mathrm{E}(h)=\int p(x) h(x) d(x) = \int p(x)/p_{M_k}(x) h(x) p_{M_k}(x) d(x),\]which suggest we can reweight each chain by $w_k(x)= p(x)/p_{M_k}(x) $. However it will not work, not only because of difficulty of density estimation $p_{M_k}(x)$, but also because $p(x)$ has a larger support than $p_{M_k}(x)$.
Second, given the initialization point $x_1$, we generate a chain $x_1,…, x_S$, and assuming we have achieved within chain convergence after a warm-up of $S_{w}$ iterations – which can be tested by the split-chain R hat, we can define the attraction probability: the probability that the chain will end up in
\[p( M_j\vert x_1) = \frac{\int_{x_{S_w},..., x_S } p(x_{S_w},..., x_S \vert x_1) p(x_{S_{w}},..., x_S \vert M_1) d x_{S_{w}}... dx_S}{\sum_j \int_{x_{S_w},..., x_S } p(x_{S_w},..., x_S \vert x_1) p(x_{S_{w}},..., x_S \vert M_j) d x_{S_{w}}... dx_S}\]It mimics the form of marginal likelihood in BMA, if we view $x_{1}$ as observed data, and $M_j$ as models. The final model weights should be $p(M_k)=\int p( M_k \vert x_1) p_{initial}(x_1) d x_1$.
BMA itself involves the computation of marginal likelihood. Alternatively we provide a inver-error type of weighting which is essentially equivalent to BMA. \(p(M_j\vert y)\propto \exp(\mathrm{elpd} (M_j))\) we call it pseudo-BMA.
However the attraction probability can be very different from the desired model weight. In the following graph the density has three modes and when the Markov chain has an over-dispersed initialization all chains initialized from the tail will be attracted to those two tail modes and make them unproportionally high in the uniformly weighted aggregation.

Yes, recovering the true posterior density is hard. But is that really the only target we are aimed at, especially if the model itself is not necessarily true the therefore the true posterior density is nothing but the parameter distribution projected into that potentially wrong model space? Does it makes sense if we are instead aimed at the best possible distribution $p(\theta\vert y)$ of the parameter $p(\theta\vert y)$ such that the model will give the best prediction performance $p(\tilde y \vert y)= \int p(\tilde y \vert \theta) p(\theta\vert y) d\theta$ for a new future data $\tilde y$?
Stacking revisit
What is the best combination of each chains in terms of the best prediction? We know how to deal with the problem: using stacking. I give a brief recap in this section.
Here we have $J$ chains of MCMC samples $(\theta_{1,1}, \theta_{1,S} ),…, (\theta_{J,1}, \theta_{J,S} )$. If each of them has converged/mixed within chain, we can denote $\theta_{j,s} \sim p_j(\theta \vert y )$.
Just as in model averaging, we could also weight a chain $(\theta_{j,1},…, \theta_{j,s})$ by its elpd, which is asymptocially equvalent to Bayesian model avering, and we call it pesudo BMA weighting.
\[w_j \propto \sum_i \log \int p(y_i\vert \theta) w_j p_j(\theta \vert y_{-i}) d\theta \approx \sum_i \log \left(\frac{\sum_s p(y_i\vert \theta_{j,s})/ p( y_i\vert \theta_{j,s}) )}{\sum_s 1/ p( y_i\vert \theta_{j,s})} \right)\]Finally we compute all the integral by \(\mathrm{E} h(\theta)\approx \sum_{j,s} w_j S^{-1} h(\theta_{j,s})\)
For a future data $y^*$ we wish to maximize the predictive ability of the model: \(\log p(y^*\vert y, w) = \log \int p(y\vert \theta) w_k p_k(\theta \vert y ) d\theta.\) This can be approxiated by leave-one-out cross validation:
\[\log p(y^*\vert \vert y, w) \approx 1/n \sum_{i=1}^n \log \int p(y_i\vert \theta) w_j p_j(\theta \vert y_{-i}) d\theta.\] \[\max_w \frac{1}{n} \sum_{i=1}^n \log \sum_{j=1}^J w_j p(y_i \vert y_{-i}, M_j) , \quad s.t. \quad w_j \geq 0, \quad \sum_{j=1}^J w_j=1.\]As usual, we do not want to fit the models n times more. We already have samples $\theta_{j,s} \sim p_j(\theta\vert y )$ from $\theta_{j,s} \sim p_j(\theta\vert y) $ therefore we can further approximate the the integral by importance sampling:
\(p(y_i \vert y_{-i}, M_j) \approx \frac{\sum_s p(y_i\vert \theta_{j,s})/ p( y_i\vert \theta_{j,s}) )}{\sum_s 1/ p( y_i\vert \theta_{j,s})}\).
We further regularize the importance sampling by Pareto Smoothed Importance Sampling (PSIS).
Example 1: Super efficiency, and the folk theorem, and how we recover the true data generating mechanism from the wrong inference
It is indeed my favorite example on the model misspecification and computation multimodality. In the true data generating mechanism (unknown to the modeler), 3/5 of the data are from $y_1,\dots, y_{60} \sim \mathrm{Cauchy} (30, 1)$ and the remaining 2/5 are from $y_{61}, \dots y_{100} \sim \mathrm{Cauchy} (-30, 1)$. The modeler has a seeming reasonable model: $y \vert \mu \sim \mathrm{Cauchy} (\mu, 1)$. The only parameter is $\mu$.

It is bimodal, centering at -30 and 30 respectively. Notably the right mode is much higher than the left mode. However the true data generating mechanism corresponds to a mixture of two delta functions: $y \vert \mu \sim \mathrm{Cauchy} (\mu, 1); \mu= Z \delta(-30) + (1-Z)\delta(30) $ where $Z\sim \mathrm{Ber}(0.4)$ The left and right mode contains to 40% and 60% of the mass: $p(\mu=-300 \mid y)/ p(\mu=-30 \mid y) = 2/3$.
We could compute the likelihood ratio $p(\mu=30 \mid y)/ p(\mu=-30 \mid y) \approx \exp(200)$. MCMC will end up with one of the mode depending on the initialization. It is indeed the folk theorem: the bimodality is exactly reflective of the data/model conflict.
The stacked distribution is below:

It is not the true posterior density given the wrong model, but it is the true data generating mechanism, and apparently optimize over the predictive performance.
Here comes the the blessing of multimodality. We almost recover the true data generating mechanism from the wrong model and wrong inference!
Example 2: The regularized horseshoe regression, and pushing the limit of mean field ADVI.
The Leukemia dataset contains gene expression measurements on 72 leukemia patients $y_i=0 \ \mathrm{ or }\ \ 1, 1\leq i\leq 72$. There is a larger set of predictors consisting of 7128 genes $x_{i,d}$. To incorporate the sparsity, we use the regularized horseshoe (Piironen et al, 2017) prior and a logistic regression: \(P(y_i=1)=\mathrm{logit}^{-1} ( \beta_{0}+\sum_{d=1}^{7128} \beta_{d} x_{i,d} ), \quad \beta_{d}\sim \mathrm{regularized\ \ horseshoe}\)
data {
  int<lower=0> n;				      // number of observations
  int<lower=0> d;             // number of predictors
  int<lower=0,upper=1> y[n];	// outputs
  matrix[n,d] x;				      // inputs
  real<lower=0> scale_icept;	// prior std for the intercept
  real<lower=0> scale_global;	// scale for the half-t prior for tau
  real<lower=0> slab_scale;
  real<lower=0> slab_df;
}

parameters {
  real beta0; // intercept
  vector[d] z; // auxiliary parameter
  real<lower=0> tau;			// global shrinkage parameter
  vector<lower=0>[d] lambda;	// local shrinkage parameter
  real<lower=0> caux; // auxiliary
}

transformed parameters {
  real<lower=0> c;
  vector[d] beta;				// regression coefficients
  vector[n] f;				// latent values
  vector<lower=0>[d] lambda_tilde;
  c = slab_scale * sqrt(caux);
  lambda_tilde = sqrt( c^2 * square(lambda) ./ (c^2 + tau^2* square(lambda)) );
  beta = z .* lambda_tilde*tau;
  f = beta0 + x*beta;
}

model {
  z ~ normal(0,1);
  lambda ~ cauchy(0,1);
  tau ~ cauchy(0, scale_global);
  caux ~ inv_gamma(0.5*slab_df, 0.5*slab_df);
  beta0 ~ normal(0,scale_icept);
  y ~ bernoulli_logit(f);
}

generated quantities {
  // compute log-likelihoods for loo
  vector[n] loglik;
  for (i in 1:n)
    log_lik[i] = bernoulli_logit_lpmf(y[i] | f[i]);
}
Vanilla variational inference does not scale well for this model, because of the multimodality. The k hat diagnostic for mean-filed ADVI is quite large. In particular there is no way a normal approximation can get that spike and slab shape correct.

That being said, I run parallel ADVI on a cluster:
args <-  Sys.getenv("SLURM_ARRAY_TASK_ID")
arrayid <- as.integer(args[1])
set.seed(as.integer(arrayid))
library(rstan)
datafile <- 'leukemia.RData'
stanmodel <- stan_model(file='glm_bernoulli_rhs.stan')
fit_advi <- vb(stanmodel, data=data, iter=1e5, output_samples=1e3,
     tol_rel_obj=0.005, eta = 1, seed=as.integer(arrayid))
save(fit_advi,file=paste("arg_", arrayid, ".RData", sep=""))
After we get 200 chains, we compute the optimal chain-wise weight using loo package:
library(loo)

n_sample=72
log_lik=array(NA, c(1000,S, n_sample)) #S: number of chains
loo_elpd=matrix(NA,n_sample, S)

for(i in 1:S)
{
  file_name=paste("arg_log_lik/loglik_", i, ".RData", sep="")
  if(file.exists(file_name))  {
    load(file_name)
    log_lik[,i,]=extract(fit_advi, pars="log_lik")
    loo_elpd[,i]= loo_chain$pointwise[,1]
     }
  }
}
st_weight=stacking_weights( lpd_point=loo_elpd)
bma_weight=pseudobma_weights(lpd_point=loo_elpd, BB=FALSE)
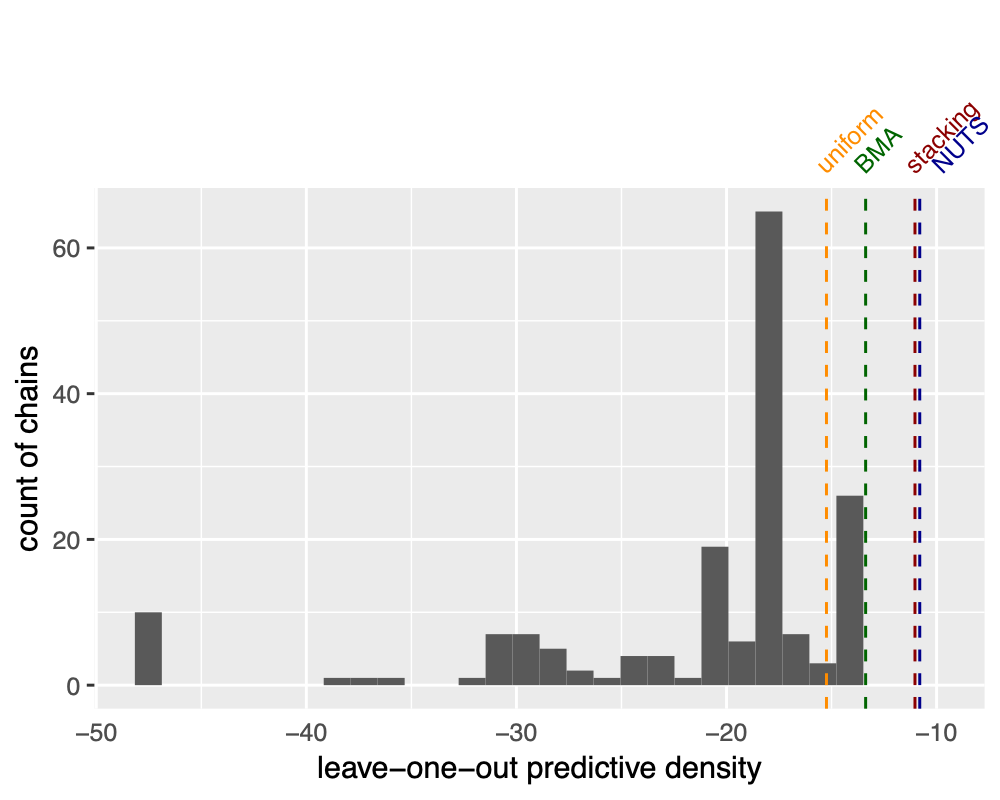
Well I did not say how many parallel runs is enough. Even though each run might take very less than one minute and almost free on a cluster, it might still be good know the number of chains is enough. To this end, we monitor the leave one out predictive of the combined distribution as a function of the number of chains to average:
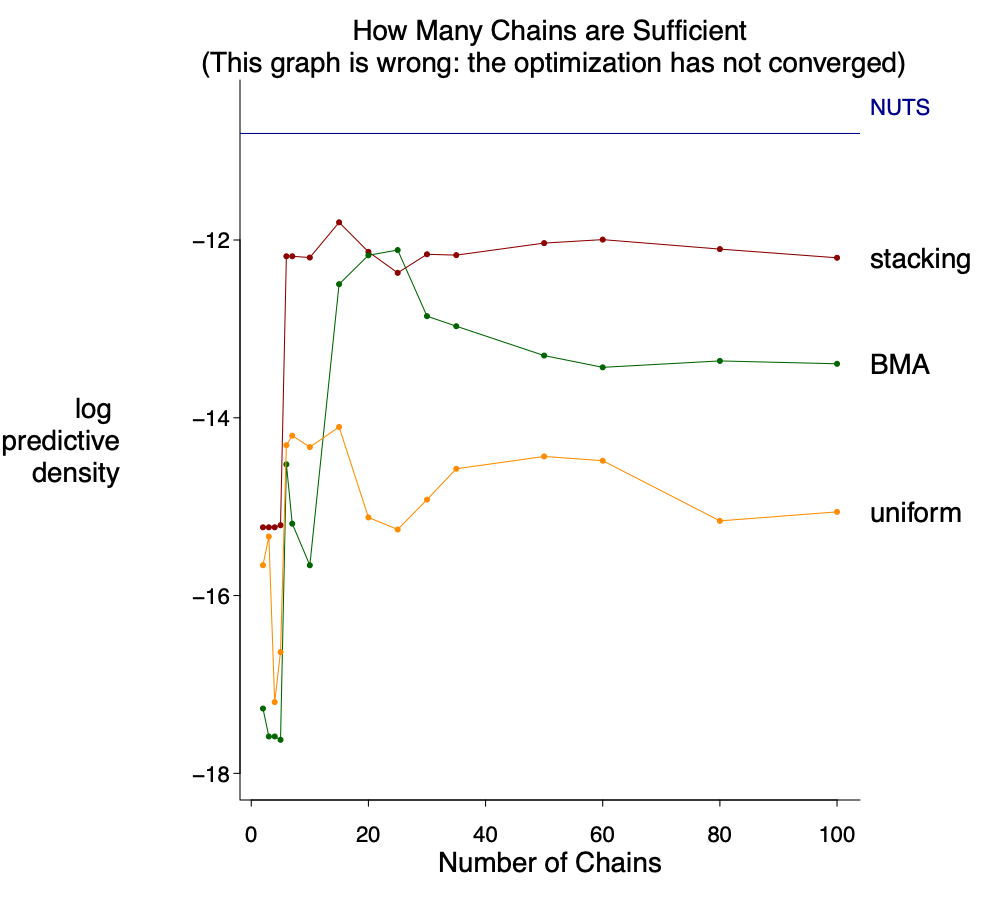
Oops it cannot be correct. How can it go down? I feel scard as I wrote this function in the loo package so it might be my bug. After careful check I realized for a large number of chains the default number of iterations in the optimization used in stacking is not enough, I increased it to 3000:
st_weight=stacking_weights( lpd_point=loo_elpd,
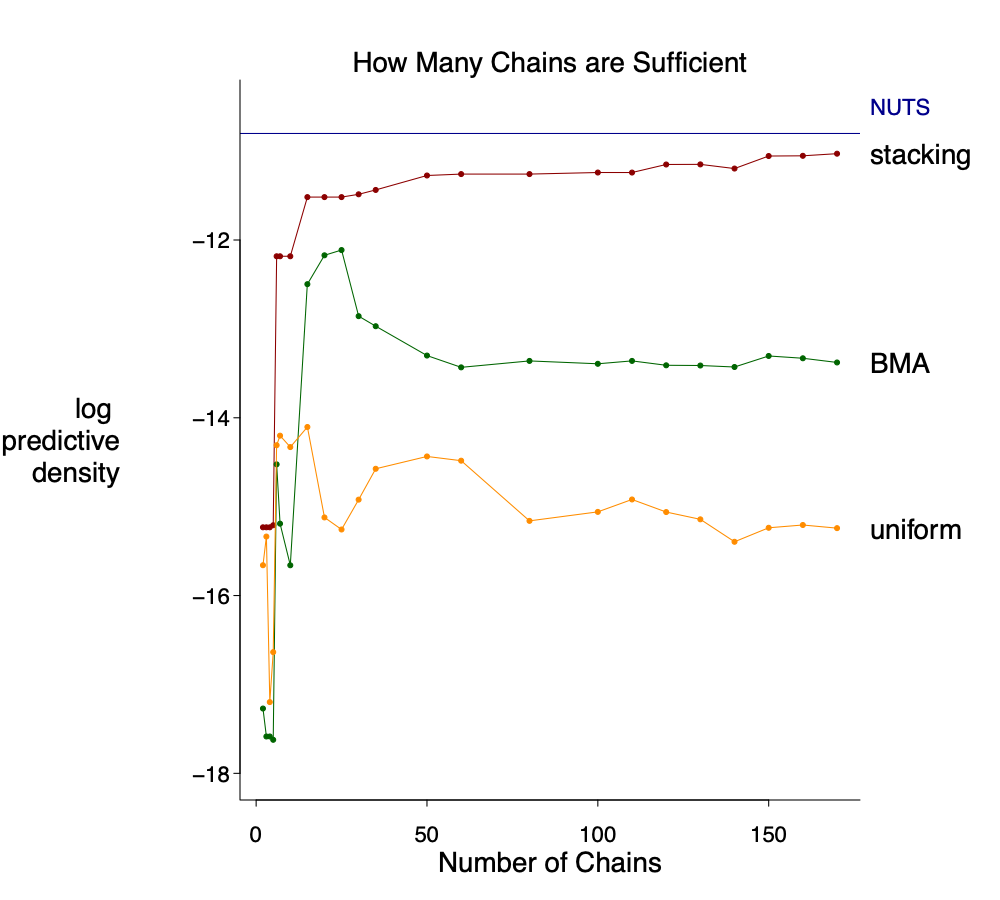
optim_control=list(maxit=3000, abstol=1e-6))
The correct graph is here. For stacking, there is a first jump at 5 chains, a second jump at 10 chains, and then almost stable afterwards. For pseudo-BMA a uniform weighting, the elpd is indeed worse when there are more chains.
Unlike the previous example, here the horseshoe model itself is quite reasonable so it makes sense if the stacked VI distributions can approximate the exact HMC draws. It is not perfect match, but it does get the main point: a spike concentrated at 0 and a slab part– Depending on the purpose, a true spike in the stacked distribution might be even more appealing in terms of interpretation.
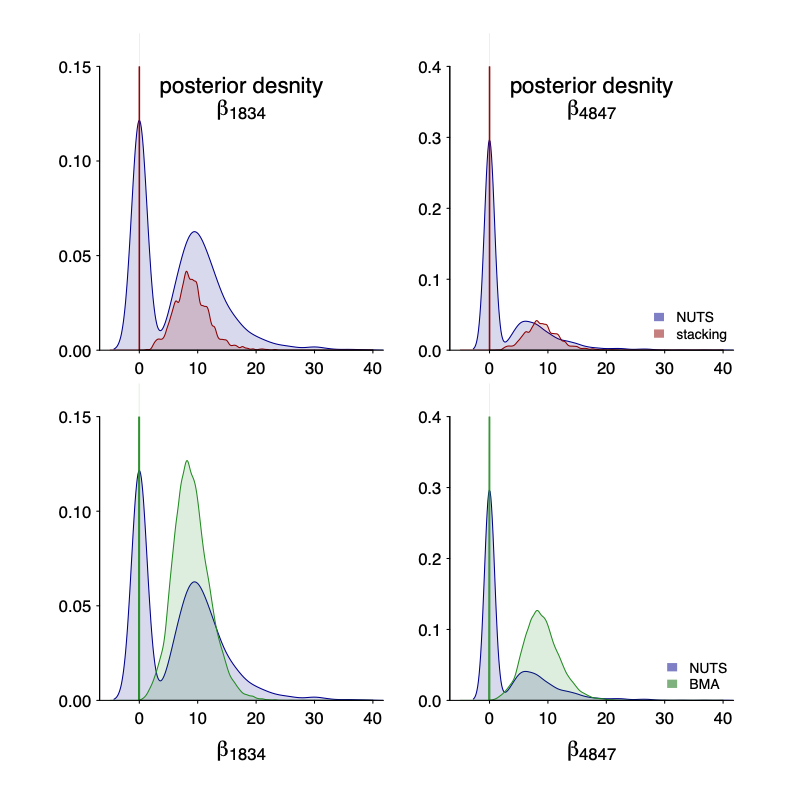
And not only the marginal, but also the joint! We plot the joint draws of $beta_1834$ and $beta_4847$. Even though each individual draws are quite off (after all it is mean-filed), the stacked version is much closer to the truth.

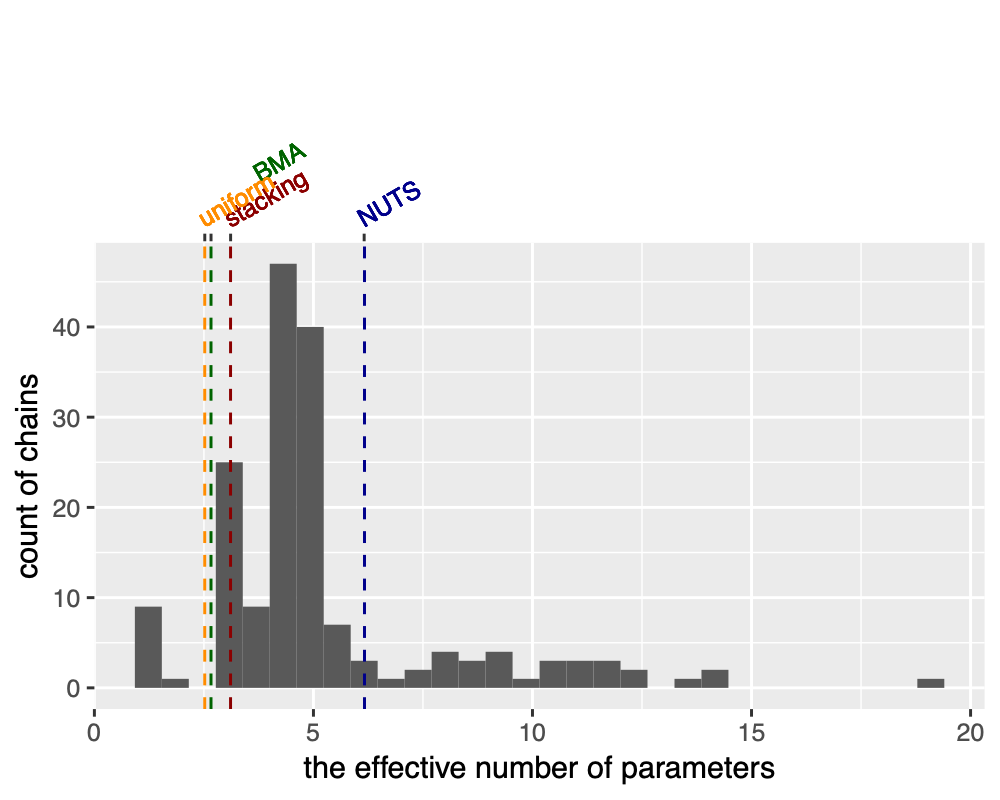
We should emphasize that computation uncertainty is part of the model, and some chains can significantly over fit. We measure that by the effective number of parameters: it varies from 1 to 20 in individual chains. The stacked one is about 3 (we compute by the same formula as the difference between loo-lpd and sample-lpd), slightly more expressive than uniform and BMA weighting, all of which are smaller than the effective number of parameters in NUTS as VI itself can be viewed as implicit regularization.
So how does the predictive performance behaves? Surprisingly the stacked VI is quite close to the NUTS result, and much better than any individual run! If anything, that is again the blessing of multi-modality: we are able to significantly improve individually-off VI chains.
As for a caveat, the variable selection from the stacked VI sample might not be the same as in NUTS: there is a large type-S error as represented by red dot below. Instead of truncate the coefficient in the stacked samples directly or using it to do variable selection, a more promising way is to combine with the projective approach (Vehtari 2018). Typically in projective approach the larger model is not optimized over given utility function. But now the large model itself is trained with the utility being aware.
Example 3: The eight-school model, the funnel, and partial pooling
The eight-school model explains the computation challenge of hierarchical models. In the high level any data cannot exclude the possibility of $\tau=0$ since it has an infinite-high density in $N(\theta\vert \tau)$. That in part leads to bimodality.
The reparameterization trick can help reduce the posterior correlation and thus remove the funnel, but we also do not know if it always help.
Here I am averaging a true zero ($\tau=0$) and 8 chains of centered parametrization. The stacked chains are better in prediction. I will fill in more details later.

Acknowledgement:
This is a preliminary and incomplete result. Please do not cite without author’s permission.
Joint work with Aki Vehtari and Andrew Gelman and others.