Napoleon's March is to a Dirichlet process what a boxplot to a Gaussian distribution
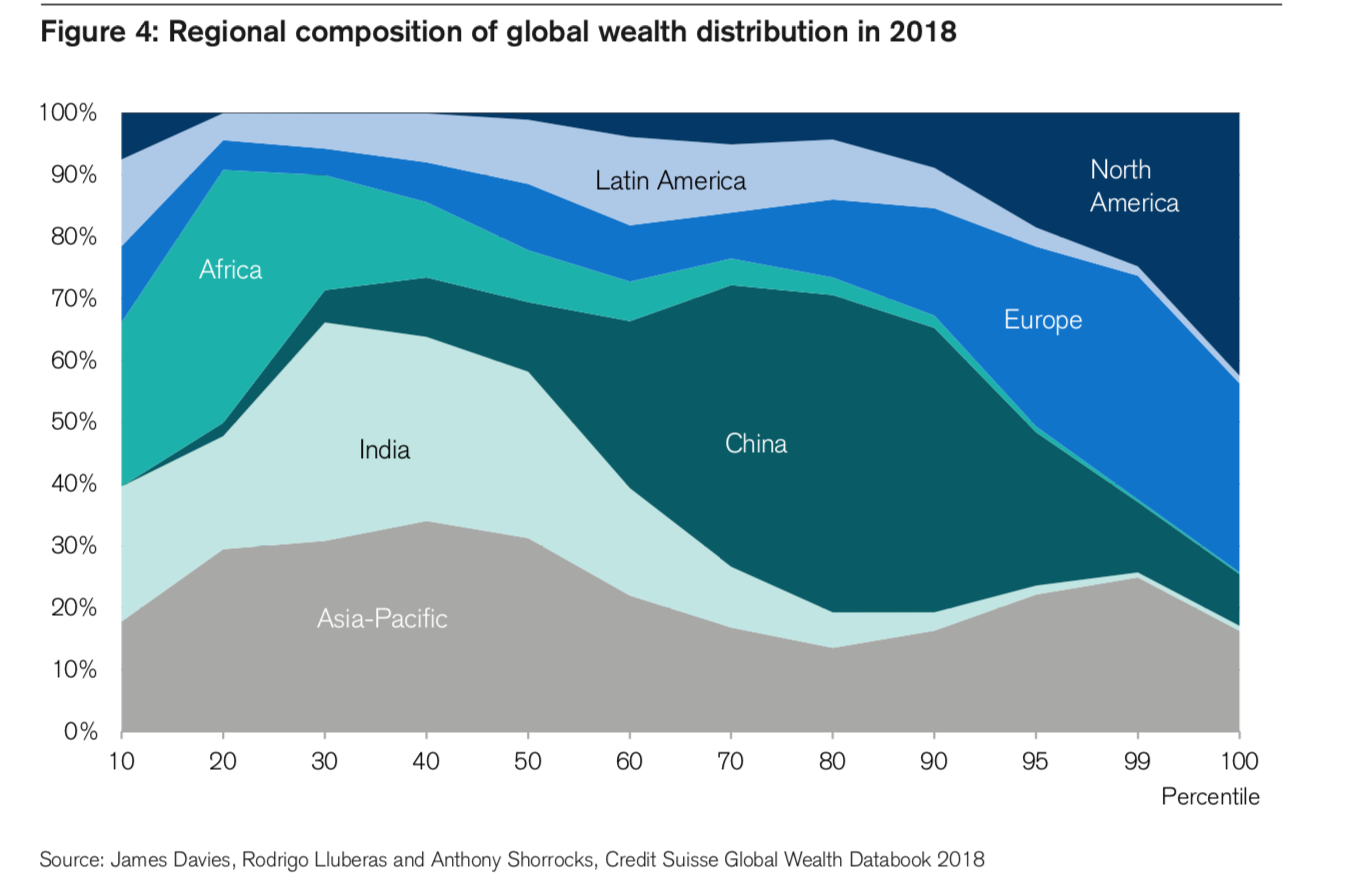
Posted by Yuling Yao on Sep 21, 2019.I saw a visualization of wealth distribution in the 2019 Credit Suisse Global Wealth Report (https://www.credit-suisse.com/about-us/en/reports-research/global-wealth-report.html)

The graph shows the how the individual wealth is distributed across regions. As written in the report:
To determine how global wealth is distributed across individuals, rather than regions or countries, we combine our estimates of the level of household wealth across countries with information on the pattern of wealth distribution within countries. Assigning individuals to their corresponding global wealth positions enables the regional pattern of wealth to be portrayed.
The graph is neither technically perfect nor conceptually novel, but I want to use it as an example to illustrate that visualization is always comparison. Here the comparison is not the region-level mean, rather it is the region-level distribution. The former one is common in a normal-normal hierarchical model, where the individual in each group has to be pooled towards the mean. As an advantage of the distribution visualization, we see some groups are definitely not unimodal gaussian. US and EU has a striking right skewness–thanks to the neoliberalism, and Asia-Pacific has clearly a bimodality due to the adhoc geographical clustering.
It is also different from the box plot, which is another way to reveal the potential discrepancy from a gaussian– notably the regional level density has to sum up to 1 for any fixed percentage.
Implicitly the graph is associated with the model: \(y_{ij} \sim f_{j}\)
$y_{ij} \in [0,1]$ is the wealth-percentage in the globe of the i-th person in the j-th region, and $f_j$ is a possibly non-parametric distribution density of the $j$’s group that satisfy: $\sum_{j=1}^J f_{j}(x) =1, \forall \in [0,1].$
We can put a Dirichlet process as a prior on the random measure $f_j$. Alternatively, we can model the individual-level wealth value directly and avoid the simplex constrains.
My point is that this graph to a boxplot is what a Dirichlet process to a gaussian distribution.
